
Source: U.S. Energy Information Administration, Annual Energy Outlooks 2009 - 2013
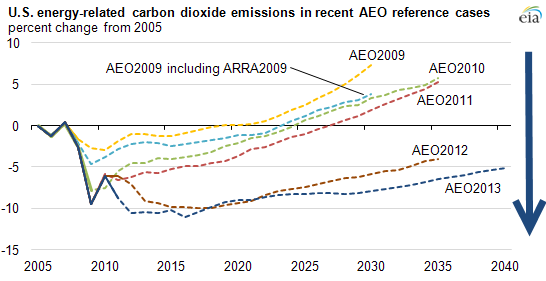
Note: Solid portions of each series show history as of each publication; dotted portions show projections. ARRA2009 denotes the American Recovery and Reinvestment Act of 2009.
Note: Solid portions of each series show history as of each publication; dotted portions show projections. ARRA2009 denotes the American Recovery and Reinvestment Act of 2009.
Projections for U.S. energy-related carbon dioxide (CO2) emissions have generally been lowered in recent editions of the Annual Energy Outlook (AEO), the long-term projections of the U.S. Energy Information Administration. The lowered projections reflect both market and policy developments that have reduced recent and projected growth in energy demand and its expected carbon intensity. The chart presents projected energy-related CO2 emissions from AEOs issued since 2009 in terms of changes relative to emissions in 2005, a commonly used comparison year, particularly with regard to mitigation targets.
From 2009 to 2013, key changes in the AEO include:
• Downward revisions in the economic growth outlook, which dampens energy demand growt
• Lower transportation sector consumption of conventional fuels based on updated fuel economy standards, increased penetration of alternative fuels, and more modest growth in light-duty vehicle miles travele
• Generally higher energy prices, with the notable exception of natural gas, where recent and projected prices reflect the development of shale gas resource
• Slower growth in electricity demand and increased use of low-carbon fuels for generation
• Increased use of natural gas
Power sector transformation, based on decarbonization of the generation mix, occurs because natural gas and renewables gain market share at the expense of coal, reflecting:
• Resource economics—high domestic production of natural gas at historically low prices, reflecting increased production of shale gas
• Regulation—updated state renewable portfolio standards and efficiency standards, and cap-and-trade provisions of California Assembly Bill 32, as well as implementation of federal policies to reduce sulfur dioxide and nitrogen oxide emissions, the Mercury and Air Toxics Standards and other policies and measures at local, state, and federal levels
No comments:
Post a Comment