New A set of maps has been posted by Williams County including one that shows oil rigs, salt water disposal sites and other wells. Click here.
New A set of charts and graphs depicting a variety of oil production trends in the state has been posted by the North Dakota Department of Mineral Resources. Click here.
Oil and Gas
 |
| Source: U.S. Energy Information Administration |
Petroleum Production 2012
Source: U.S. Energy Information Administration
 |
| Source: U.S. Energy Informatoin Administration |
 |
| Source: USGS (AU=assessment unit) Source: ND Department of Mineral Resources Click map for larger version Click link below for jumbo version ND Pipeline Authority
Natural Gas Processing Capacity
Source: ND Pipeline Authority
Click for chart larger image
|
Oil Transport Options
Source: ND Pipeline Authority
Click for chart larger image
Links
• North Dakota crude oil gathering map February update
• North Dakota natural gas gathering map
• North Dakota rail loading facilities map new
• North Dakota historical monthly production (graph)• North Dakota natural gas gathering map
• North Dakota rail loading facilities map new
• North Dakota GIS map server
• North Dakota DMR recent presentations
Wind Energy
Source: American Wind Energy Association
 |
| Source: National Renewable Energy Laboratory |
 |
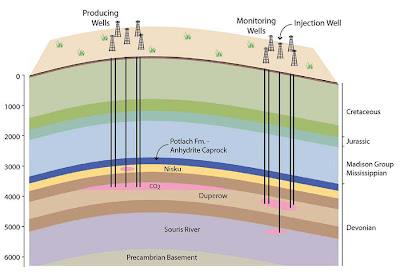
| Source: National Renewable Energy Laboratory U.S. Carbon Storage Projects Bell Creek Field Project, Montana Source:NETL Kebin Dome Project, Montana Source: NETL |
Geothermal
 |
| Source: National Renewable Energy Laboratory |
Coalbed Methane


.png)
.jpg)


