
Source: U.S. Energy Information Administration, Natural Gas Monthly and Short-Term Energy Outlook (STEO)
Note: October 2013 and November 2013 consumption volumes represent preliminary STEO estimates.
Note: October 2013 and November 2013 consumption volumes represent preliminary STEO estimates.
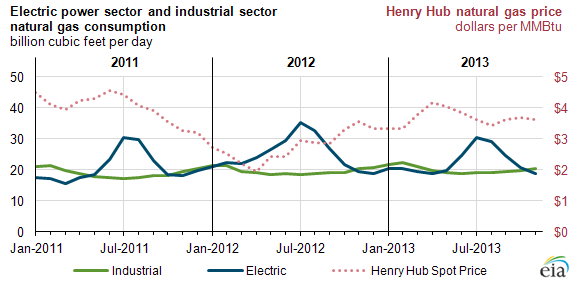
For the first eleven months of 2013, natural gas consumption in the electric power sector was below 2012 levels because of relatively higher natural gas prices compared with coal prices, and cooler summer weather compared with 2012. EIA estimates that electric power sector natural gas consumption was, on average, down by 13% so far in 2013 (through November), relative to the same time period in 2012. By contrast, industrial sector natural gas consumption in 2013 was up 3% compared with 2012.
Electric power sector
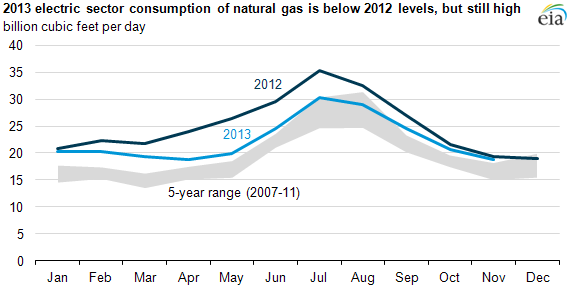
Changes in electric power sector consumption of natural gas are primarily attributable to commodity prices. For the first eleven months of 2012, the benchmark natural gas spot price at Henry Hub averaged $2.70/MMBtu. For the same months in 2013, the average Henry Hub price was $3.68/MMBtu, somewhat higher than the previous year's levels, lowering electric-sector demand for natural gas. Accordingly, natural gas lost some of its electric-sector market share to coal in 2013, but it is still being consumed at rates generally above the 2007-2011 range. Electric power plants are dispatched, or called into service, based on their variable cost of operation, which is determined by both the price of the power plant's fuel and the efficiency of the plant.
Because natural gas and coal are the primary fuels used to generate electricity in the United States, the decline in gas prices delivered to electricity generators (from an average level of $8.87/MMBtu in 2008 to $3.43/MMBtu in 2012 and $4.37/MMBtu for the first eleven months of 2013) and the increased role of natural gas in electric generation are applying downward pressure on coal prices.
Source: U.S. Energy Information Administration, Natural Gas Monthly and Short-Term Energy Outlook (STEO)
Note: October 2013 and November 2013 consumption volumes represent preliminary STEO estimates.
Note: October 2013 and November 2013 consumption volumes represent preliminary STEO estimates.
Demand for air conditioning is one of the major drivers of summer peak electricity loads, which typically require the highest amounts of gas-fired generation. Air conditioning demand is closely related to the number of cooling degree days (CDDs), a measure that reflects both the level and duration of high temperatures. In addition to less gas per CDD being consumed in 2013 versus 2012 because of the price effects mentioned above, there has been an overall reduction in CDDs this year. July and August, which are typically the hottest months, both saw substantially fewer CDDs in 2013 than in 2012. This cooler weather further reduced electric-sector demand for natural gas compared with last year. As a percentage of total natural gas end-use consumption across all sectors, the electric sector has accounted for 35% so far in 2013 (through November), down from 40% in the same months of 2012.
Industrial sector
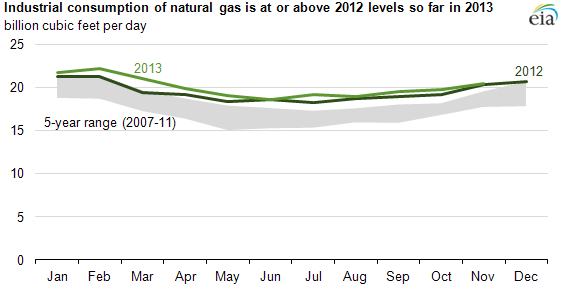
Industrial consumption of natural gas has been increasing in recent years. Continuing the trend from earlier in the year, industrial gas consumption was up 0.6 billion cubic feet per day (Bcf/d), or 3%, through November 2013, compared with the same months in 2012. Nearly all facilities with the ability to switch from oil to natural gas as a fuel or feedstock made this change before 2011, given the large cost advantage of natural gas. At the same time, lower natural gas prices in the United States relative to those in Japan and Europe have made U.S. energy-intensive industries more competitive globally, allowing them to capture a larger share of global markets. New industrial demand for natural gas is expected to continue to grow as additional manufacturing capacity in gas-intensive industries comes into operation.
Source: U.S. Energy Information Administration, Natural Gas Monthly and Short-Term Energy Outlook (STEO)
Note: October 2013 and November 2013 consumption volumes represent preliminary STEO estimates.
Note: October 2013 and November 2013 consumption volumes represent preliminary STEO estimates.
No comments:
Post a Comment